Different Methods of Calculating Load
Before we dive into Linux load averages, we must explore the different ways load is calculated and address the most common measurement of CPU load - a percentage.
Windows calculates load differently from Linux, and since Windows has been historically more popular on the desktop, the Windows definition of load is generally understood by most computer users. Most Windows users have seen the system load in the task manager displayed as a percentage ranging from 0% to 100%.
In Windows this is derived by examining how “busy” the System Idle Process is and using the inverse to represent the system load. For example, if the idle thread is executing 99% of the time, CPU load in Windows would be 1%. This value is easy to understand but provides less overall detail about the true status of the system.
In Linux, the load average is instead is represented by a decimal number starting at 0.00. The value can be roughly defined as the number of processes over the past minute that had to wait their turn for execution. Unlike Windows, Linux load average is not an instant measurement. Load is given in three values - the one minute average, the five minute average, and the fifteen minute average.
Understanding Load Average in Linux
At first, this extra layer of detail seems unnecessary if you simply want to know the current state of CPU load in your system. But since the averages of three time periods are given, rather than an instant measurement, you can get a more complete idea of the change of system load over time in a single glance of three numbers
Displaying the load average is simple. On the command line, you can use a variety of commands. I simply use the “w” command:
root@virgo [~]# w21:08:43 up 38 days, 4:34, 4 users, load average: 3.11, 2.75, 2.70
The rest of the command will display who's logged on and what they're executing, but for our purposes this information is irrelevant so I've clipped it from the above display.
In an ideal system, no process should be held up by another process (or thread), but in a single processor system, this occurs when the load goes above 1.00.
The words “single processor system” are incredibly important here. Unless you're running an ancient computer, your machine probably has multiple CPU cores. In the machine I'm on, I have 16 cores:
root@virgo [~]# nproc16
In this case, a load average of 3.11 is not alarming at all. It simply means that a bit more than three processes were ready to execute and CPU cores were present to handle their execution. On this particular system, the load would have to reach 16 to be considered at “100%”.
To translate this to a percent-based system load, you could use this simple, if not obtuse, command:
cat /proc/loadavg | cut -c 1-4 | echo "scale=2; ($(This command sequences isolates the 1-minute average via cut and echos it, divided by the number of CPU cores, through bc, a command-line calculator, to derive the percentage.This value is by no means scientific but does provide a rough approximation of CPU load in percent.
A Minute to Learn, a Lifetime to Master
In the previous section I put the “100%” example of a load of 16.0 on a 16 CPU core system in quotes because the calculation of load in Linux is a bit more nebulous than Windows. The system administrator must keep in mind that:
- Load is expressed in waiting processes and threads
- It is not an instantaneous value, rather an average, and
- It's interpretation must include the number of CPU cores, and
- May over-inflate I/O waits like disk reads
Because of this, getting a handle of CPU load on a Linux system is not entirely an empirical matter. Even if it were, CPU load alone is not an adequate measurement of overall system resource utilization. As such, an experienced Linux administrator will consider CPU load in concert with other values such as I/O wait and the percentage of kernel versus system time.
I/O Wait
I/O wait is most easily seen via the “top” command:
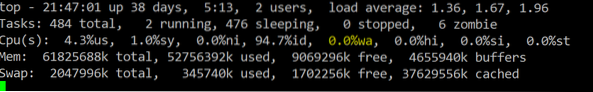
In the screenshot above I have highlighted the I/O wait value. This is a percentage of time that the CPU was waiting on input or output commands to complete. This is usually indicative of high disk activity. While a high wait percentage alone may not significantly degrade CPU-bound tasks, it will reduce I/O performance for other tasks and will make the system feel sluggish.
High I/O wait without any obvious cause might indicate a problem with a disk. Use the “dmesg” command to see if any errors have occurred.
Kernel vs. System Time
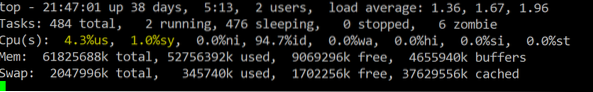
The above highlighted values represent the user and kernel (system) time. This is a breakdown of the overall consumption of CPU time by users (i.e. applications, etc.) and the kernel (i.e. interaction with system devices). Higher user time will indicate more CPU usage by programs where higher kernel time will indicate more system-level processing.
A Fairly Average Load
Learning the relationship of load average to actual system performance takes time, but before long you'll see a distinct correlation. Armed with the intricacies of system performance metrics, you'll be able to make better decisions about hardware upgrades and program resource utilization.